Summary
Our aim is to minimize the unplanned downtime that trucks frequently face using a hybrid approach to analytical modeling. To achieve the goal we have identified two scenarios when system deterioration can be detected: outright failure of system causing immediate downtime and slow deterioration due to ware. We developed five models using six data sources to recommend solutions to both these scenarios. In the long run, we expect the outright failures to considerably reduce leading to significant gain on time spent on unplanned repairs.
Problem Description
This problem was featured in SAS’s official website under customer success stories page [1], under the title “the IoT data with artificial intelligence reduces downtime, helps truckers keep on trucking”. Transportation and logistic industry (T&L) plays a huge part in ensuring the global supply chain and commerce happens without disruption. Global e-commerce purchases was valued at about $26.7 trillion USD in 2020 and unplanned vehicle downtime costed fleet companies about $3.3 billion USD [2].
Truck manufacturer AB Volvo helped its clients with remote diagnostic and preventative maintenance services based on Internet of Things (IoT) technologies with analytics and artificial intelligence (AI) [1] to solve this problem. The real-time sensor readouts from their trucks was a key technological development that allowed their engineers and mathematicians to employ sophisticated analytics to identify and predict downtime. In this report, I will try to recreate the analytics modelling architecture that the truck manufacturer developed to solve the problem of unplanned downtime.
This problem is interesting to me because the objective is broad in scope. It requires us to identify multitude of scenarios under which downtime could be happen and then employ a variety of modeling combinations to solve the problem. We will explore prescriptive and predictive modelling approaches for various scenarios. We also need to take into account the complexity of modern day trucks. Each system and corresponding sub-systems, like: Internal combustion Engine (ICE), transmission, safety, tires, Suspension actuators, loading bay controller etc, could provide thousands of data points every second. Combine this with location specific climate conditions and driver experience level, we are looking at enormous amounts of failure points to follow.
Assuming two states for system condition: failed and high chances of failure in finite time, we shall have two types of service call: repair and preventive maintenance and two different scenarios for downtime. First being failed system causing unplanned downtime requiring service call with immediate response for repairing the truck. The second scenario will be a failing system needing preventive maintenance within a finite period of time after which it turns into the first scenario. Scenario-2 will invariably lead to unplanned downtime and will affect the fleet company’s bottom line if left unattended.
We face the following challenges in scenario-1: if the failure is real or if it is a bad signal from a malfunctioning sensor, another challenge is that not all sub-system failure will result in immediate stoppage/breakdown of the truck, but driving with that failed subsystem could be a potential danger and could eventually cause complete system failure or accidents etc, so cannot categorize this as preventive maintenance (scenario-2). Malfunctioning sensors is also an important challenge for scenario-2.
When the first scenario is detected and if the vehicle is still in working condition we calculate the probability of sensor malfunction using probability distributions. If that probability is in acceptable range, we calculate the severity of the part failure using a predictive model and based of how severe the issue, we make a decision to invoke service call. Once a decision to invoke a service call is made, we calculate the closest service personnel from the location of the truck using spatial k-NN. Finally using the service center’s past records, we forecast the time and cost of repair.
A more common action take by our analytics approach is to tackle Scenario-2. We calculate monitor the sensor data in every system in the truck and using a combination of time series change detection model and a probability distribution model, we flag a part or whole system when they cross a threshold set by our change detection model. We then use a predictive model to consider the age of the flagged part, driver profiles, locations, climate and other attributes to predict the part’s failure chances.
Based on the results of the predictive model and the truck’s schedule we invoke a service call for preventive maintenance. We then calculate the closest service canter from the location of the truck’s schedule in the future time using a spatial k-NN. Finally using the service center’s past records, we forecast the expected downtime and cost of service.
We will look at each of these scenarios, the combinations of models we use for them, the data sets available and the final architecture workflow in the upcoming sections of this report. The models section will cover each of the analytics model in detail. The data section will cover the data sets and how they are collected and updated. The flow section puts the models, scenarios and the data together to develop a working solution for the truck company’s problem of unplanned downtime. Conclusion section will talk about the pros and cons of our proposed approach. The reference section will cover additional resources and urls.
Models
We have identified five models that could be used across for the two scenarios discussed in the introduction. The five models are failure detection using probability distribution, forecasting severity of deterioration, change detection with exponential smoothing, spatial k-NN for finding nearest set of service center options and forecasting cost and duration of maintenance. We shall discuss each of these models below.
Model-1 Failure detection using probability distribution
Given part/system age and failure history, use weibull distribution with k>1 to determine probability of failure. We can use this model to classify if the signal coming out of sensor as bad or good. In a way this model serves as a foolproof gateway for the entire solution. This model helps us trust the sensor data with some confidence.

Model-2 Forecasting severity of deterioration/failure
Given Part/system name, probability of failure from model-1 and a dataset containing historic service data for the part, driver history and climate conditions, we could use logistic regression to predict the severity of failure or deterioration of the part. This model is also a commonly used for both the scenarios. The could use the resulting probability from the logistic regression to classify if the part has failed for scenario-1 and if a part requires preventive maintenance in scenario-2. The classification would depend on the threshold we set for these classification. One example could be of fixing 95% and above for failed part and between 75% and 95% for preventive maintenance.

Model-3 Change detection with exponential smoothing
Given sensor data, part age, season details, use time series three parameter exponential smoothing methods like Holt-winters method to determine definitive change and flag the part/ sub-system for preventive maintenance.

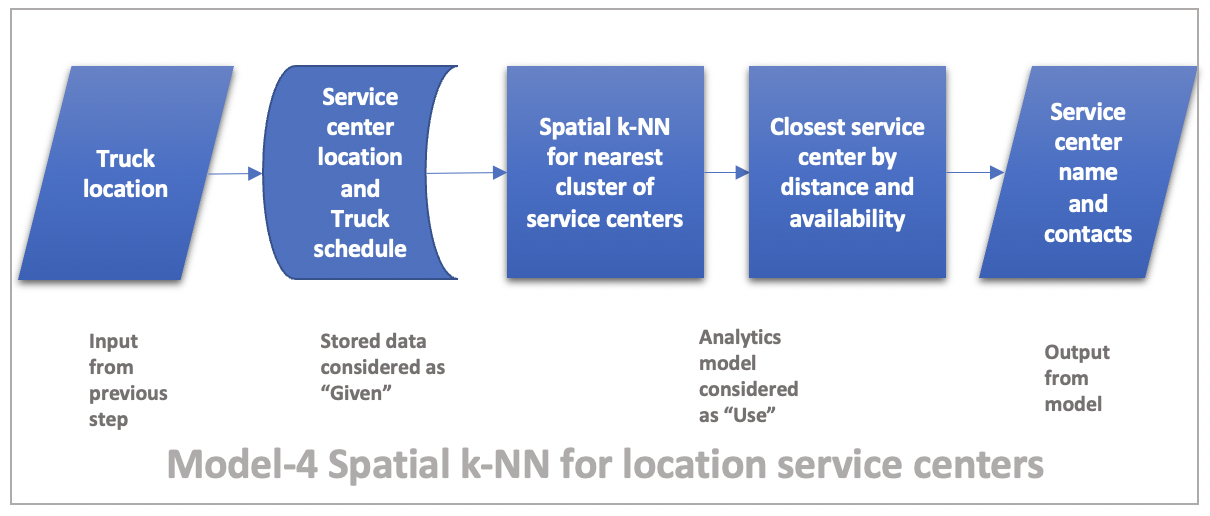
Model-4 Spatial k-NN for finding nearest service center options
Given vehicle location, truck schedule, service center locations and availability, use spatial k-Nearest Neighbors method to calculate a cluster of available service centers. We then take this data and use discrete optimization methods like network optimization to calculate the closest service available center based on truck’s status.

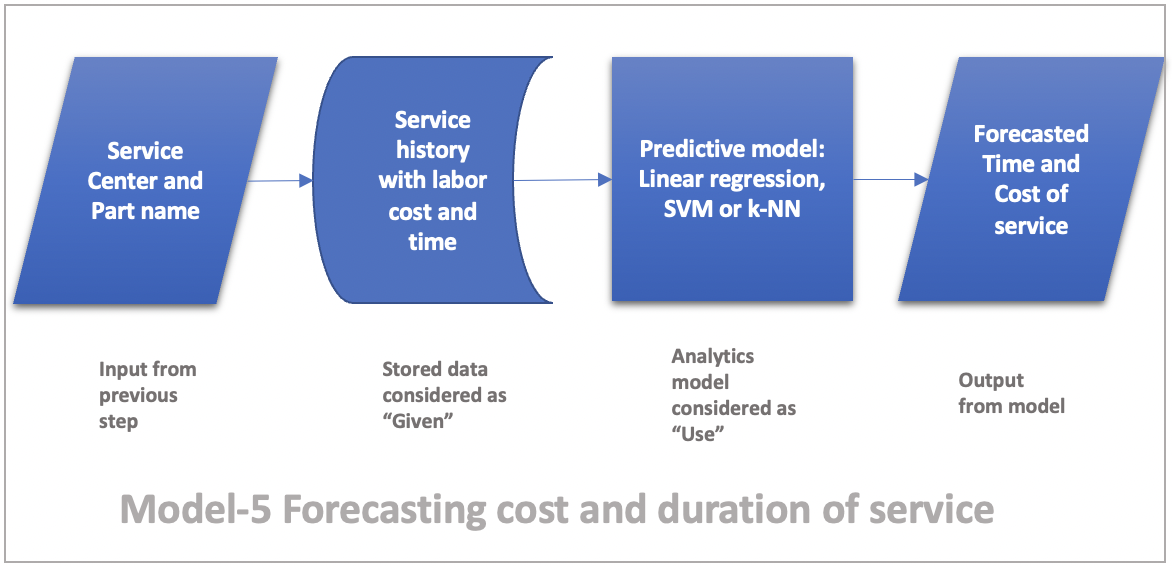
Model-5 Forecasting cost and duration of maintenance
Given service center name from previous step, service type history with costs and duration, use predictive models like linear regression, k-NN or SVM to estimate cost and duration of service.

Data
In this section lets explore all types of stored and streaming data available for this analytics system we are developing. We have X data sets to explore: sensor data from various parts of the truck, service center locations and schedule across the geography of operation of the trucks, truck’s hauling schedule, parts details including history of failures, driver details, service records for each part.
Data-1 Sensor data from various parts of the truck
The scope of this project is so big and rich which is evident in the types of sensor data you could get from the truck. As mentioned in the description [1], each part that belongs to a system or sub-system can have a sensor monitoring key parameters and transmitting them over the cloud. So we are looking at a stream of data with time element. A short list of the systems in consideration could be Internal combustion Engine (ICE), transmission, safety, tires, Suspension actuators, loading bay controller etc. An example of part or sub-system sensor data could be a tire pressure monitoring system (TPMS).
We sould consider tire as a sub-system of the transmission system in this case. The sensor will provide pressure data every few minutes. So if tire pressure goes below the threshold this change could be detected and flagged. Similarly if there was a incident causing tires to puncture, TPMS will send unusually low numbers and that could trigger scenario-1 very soon leading to a service call for repair. Another example of sensor data would be oil temperature data from the engine bay. There will be thousands of sensor data coming from any of the trucks we are dealing with for this problem. The sample architecture we provide will in section-5 named flow deals with one type of sensor data. Our system should be deployed in powerful parallel processing compute nodes to handle thousands of such instances simultaneously. Data refresh rate/update frequency could vary between seconds to minutes as these are from live sensors.

Data-2 Service center locations and schedule
This is also a dynamic data set but this wouldn’t be classified as a streaming data. This should contain locations of service centers across the regions where the truck company;s fleets operate with reasonable buffer zones to account for eventualities like detour due to extreme conditions. Location attributes like service center name, address, country, state/region, postalcode, and availability attributes like number of workstations, number of mechanics, number of mechanics occupied on priority jobs, number of mechanics available will be a part of this data set. Data refresh rate/update frequency could be anywhere between 6-12 hours. Or could be instantaneous of the service center uses cloud based ERP (enterprise resource planning) systems to update their schedule.

Data-3 Truck’s hauling schedule
Truck’s fright schedule should be updates every few few mins. This is because this data is also ties to the truck’s current location. Even though future schedules may not vary with much frequency. Data refresh rate/update frequency could range from mins to few hours. Attributes like plate number, vin number, current coordinates, current drop-off/loading loc, next five load/unload locations, driver profile, cleaner driver profile.

Data-4 Parts details including history of failures
This is a historic data that gets refreshed only when there is a new flag be it for preventive maintenance or for failure. Attributes like partID, part type, sub-system, system, number of preventive flags, number of repair flags, time between flags. Data refresh is triggered when a new flag gets raised and that could vary by part type.

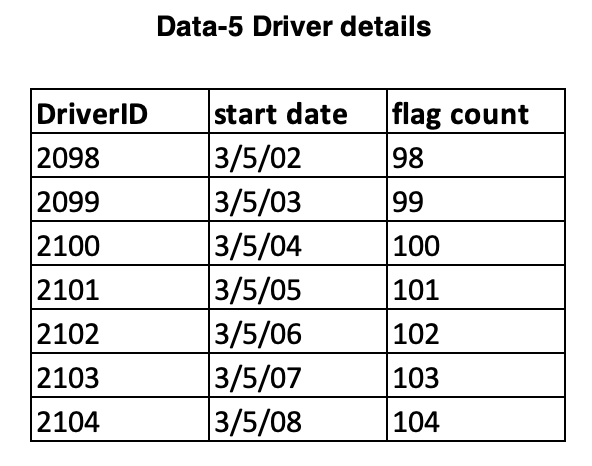
Data-5 Driver details
Driver profile includes availability, experience, truck type, number of flags accumulated. Data refresh rate is limited and will be triggered when flag gets raised.

Data-6 Service records for each part
Service records includes details of parts that went through repair, replacement and preventive maintenance. This also includes the time take for service and price associated each service incident.

Flow
In this section we shall look at the final architecture of our solution. As mentioned in the previously each part that belongs to a system or sub-system can have a sensor monitoring key parameters and transmitting them over the cloud. So we are looking at a stream of data with time element. A short list of the systems in consideration could be Internal combustion Engine (ICE), transmission, safety, tires, Suspension actuators, loading bay controller etc. An example of part or sub-system sensor data could be a tire pressure monitoring system (TPMS). We sould consider tire as a sub-system of the transmission system in this case. The sensor will provide pressure data every few minutes. So if tire pressure goes below the threshold this change could be detected and flagged. Similarly if there was a incident causing tires to puncture, TPMS will send unusually low numbers and that could trigger scenario-1 very soon leading to a service call for repair.
Another example of sensor data would be oil temperature data from the engine bay. There will be thousands of sensor data coming from any of the trucks we are dealing with for this problem. The sample architecture we provide will in section-5 named flow deals with one type of sensor data. Our system should be deployed in powerful parallel processing compute nodes to handle thousands of such instances simultaneously.
The predictive models used for models 2 and 5 shall be refreshed every time a new flag incident gets triggered. Models 1 and 4 are always online. Model-3 is threshold is set by experts manually and should be reset every time new flag incident gets triggered for the particular part.
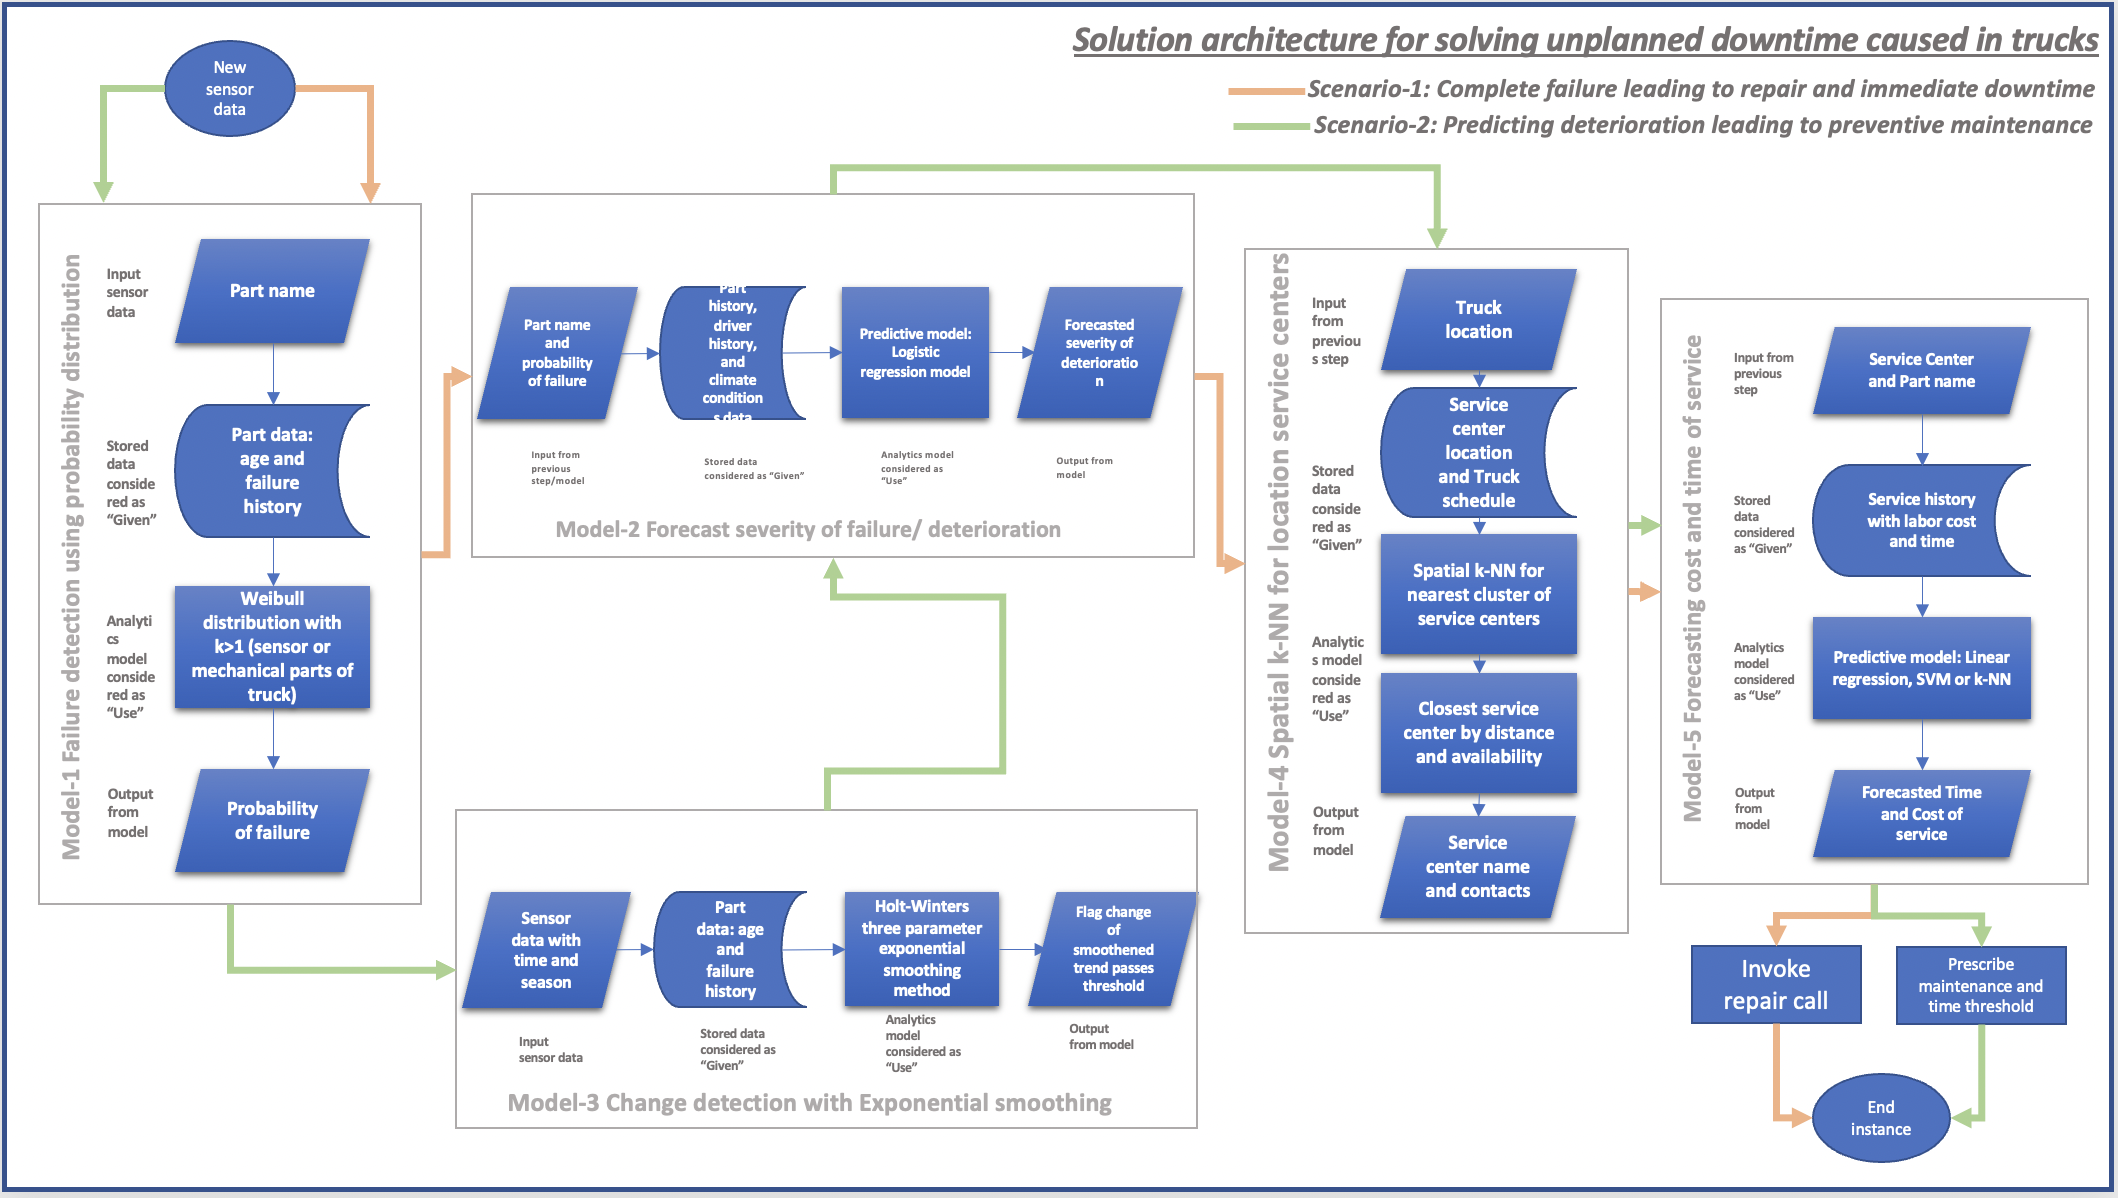
So far, we have looked at two scenarios, five types of models and six different data sets. We are attaching the workflow below in Figure-12. The models and data sets above can be combined multiple ways for each of the two scenarios to calculate the final recommendation of action. For the was of understanding and for simplicity this flowchart shows both scenarios in one diagram. The flow lines in orange indicates scenario-1 and green flow line indicates scenario-2.

Conclusion
This report was meant to be an exercise for anyone learning to think about analytics as a system for solving complex problems. I enjoyed the interplay of these models and the challenges posed by the truck problem. There are rooms for improvement, especially in ways we use optimization for scheduling purposes. Also one other area that I couldn’t do justice is Model-2. We are currently considering a linear regression but am sure based on actual sensor readings and type this could be fine tuned with a more fitting model. The infrastructure side of this solution is equally challenging and mind blowing.
Reference
IoT data with artificial intelligence reduces downtime, helps truckers keep on trucking (case description featured in customer success story page from www.sas.com): https://www.sas.com/en_us/customers/volvo-trucks-mack-trucks.html (Accessed: Apr 04, 2022)
The cost of downtime: https://soti.net/resources/blog/2021/the-cost-of-downtime-if-the-wheels-don-t-turn-you-don-t-earn/ (Accessed: Apr 04, 2022)